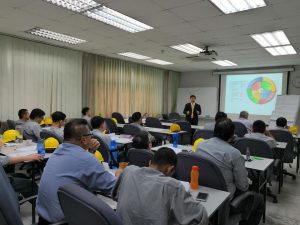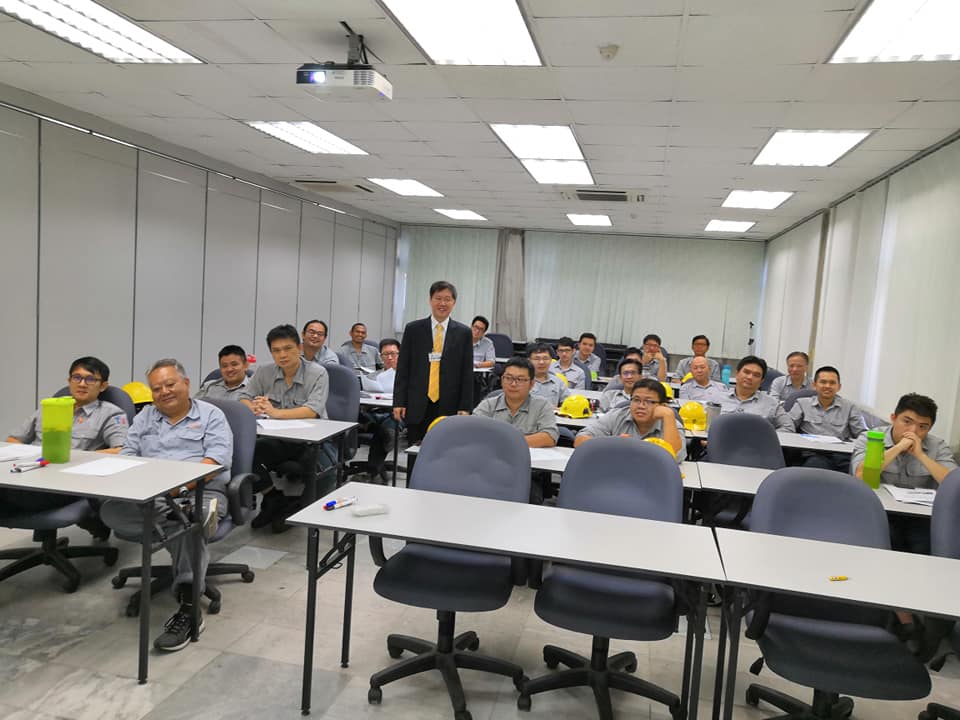
On 22 to 24 Apr 2019 I conducted the Engineering 7QC and New 7 QC Training and lectures for China Steel Corporation (CSC – HQ at KaoShiong Taiwan) at Melaka factory, to a group of 25 engineers and technical specialist. 荣耀归上帝我们的神耶和华 ! 我教导工程七个质量管理系统课程给中国钢铁集团马六甲分公司25位工程师和技术专员 !
Outline: New 7 QC Methodology
SECTION 1: Quality
• Definition of Quality
• ISO Definition on Quality
• What is Quality?
• Quality Discrepancy
• How to Control Discrepancy?
• To Control Production
• QC and QA
SECTION 2: Data
• The Objective to Take the Data.
• The Way of Grasping the Fact Correctly “5W1H”.
• How to Summarize the Data?
SECTION 3: Activities
SECTION 4: Various QC Method
• Effect of the QC Method.
• QC methods as a Communication Tool.
SECTION 5: New 7 QC
• Many new QC method
• Deep dive into new QC methodology
SECTION 6: Activities
• Group activities
• Discussion and presentation
SECTION 7: DMAIC Method
• INTRODUCTION TO DMAIC PRSENTATION
o What is Six Sigma
o Basic of Six Sigma
• DMAIC OVERVIEW
o What is DMAIC
o DMAIC and the Process Improvement Road map
o DMAIC Simple Chart Guidelines
• DEFINE PHASE
o The primary outputs of the Define Phase
o Define Phases (in summary)
o Project & Team Selection
o Team Charter
• MEASURE PHASE
o The primary outputs of the Measure Phase
o Task perform in Measure phase
o Measure Phase Step by Step Guide
o Determine What to Measure, how to Measure
o Manage the Measurement Process
• ANALYZE PHASE
o The primary outputs of the Analyze Phase
o Analyze Phase Visually
o Graphical Representation and Understanding of Analyze Phase
o Common Tools used in the DMAIC Analyze Phase
• IMPROVE PHASE
o The primary outputs of the Improve Phase
o Objectives of Improve Phase
o Identifying Potential Solutions
o Selecting Solutions to Implement
o Implementing Improvements
o Evaluating Improvements
• CONTROL PHASE
o The primary outputs of the Control Phase
o Plans for Holding the Gains
o Procedures and Standards
o Process Control Systems
SECTION 8: Conventional 7 QC – revision
5.1 STRATIFICATION
To classify the data in the same groups, which have a common matter of data, eg. For each machine, each material, each operation method etc.
5.2 CHECKSHEET
To analyze the situation and to look at the important questions which depending on the check done and the available data table or diagram is derived.
5.3 PARETO DIAGRAM
To learn the method on gathering the information from check sheets and eliminate minor problems, leaving only the main problems to be surfaced.
5.4 CAUSE AND EFFECT DIAGRAM
Using the fishbone diagram to display the effect (result) which is influenced by the main factors (causes).
5.5 HISTOGRAM
To analyze the data which has a tendency to be centered upon a maximum of large numerical value and placed into columnar graph form. It indicates a frequency distribution in which the width of adjacent vertical bars are proportional to the class width of the variables & the heights of the bars are proportional to the class frequencies.
5.6 SCATTER DIAGRAM
To analyze the situation which able to see the congenial relationship of the data through plotting the vertical axis and the horizontal axis. It examines the relationship between one data and other, and level of the relationship.
5.7CONTROL CHART
To grasp the variation in the data entered through planning the control limit lines of a centre line, an upper control limit and a lower control limit.
SECTION 9: Exam and Presentation of certificates